Gantt chart and board
dotPulse gives you two visual ways to follow work: the Gantt chart shows projects and tasks on a timeline, and the board shows a project's tasks as cards by progress.
The Gantt chart
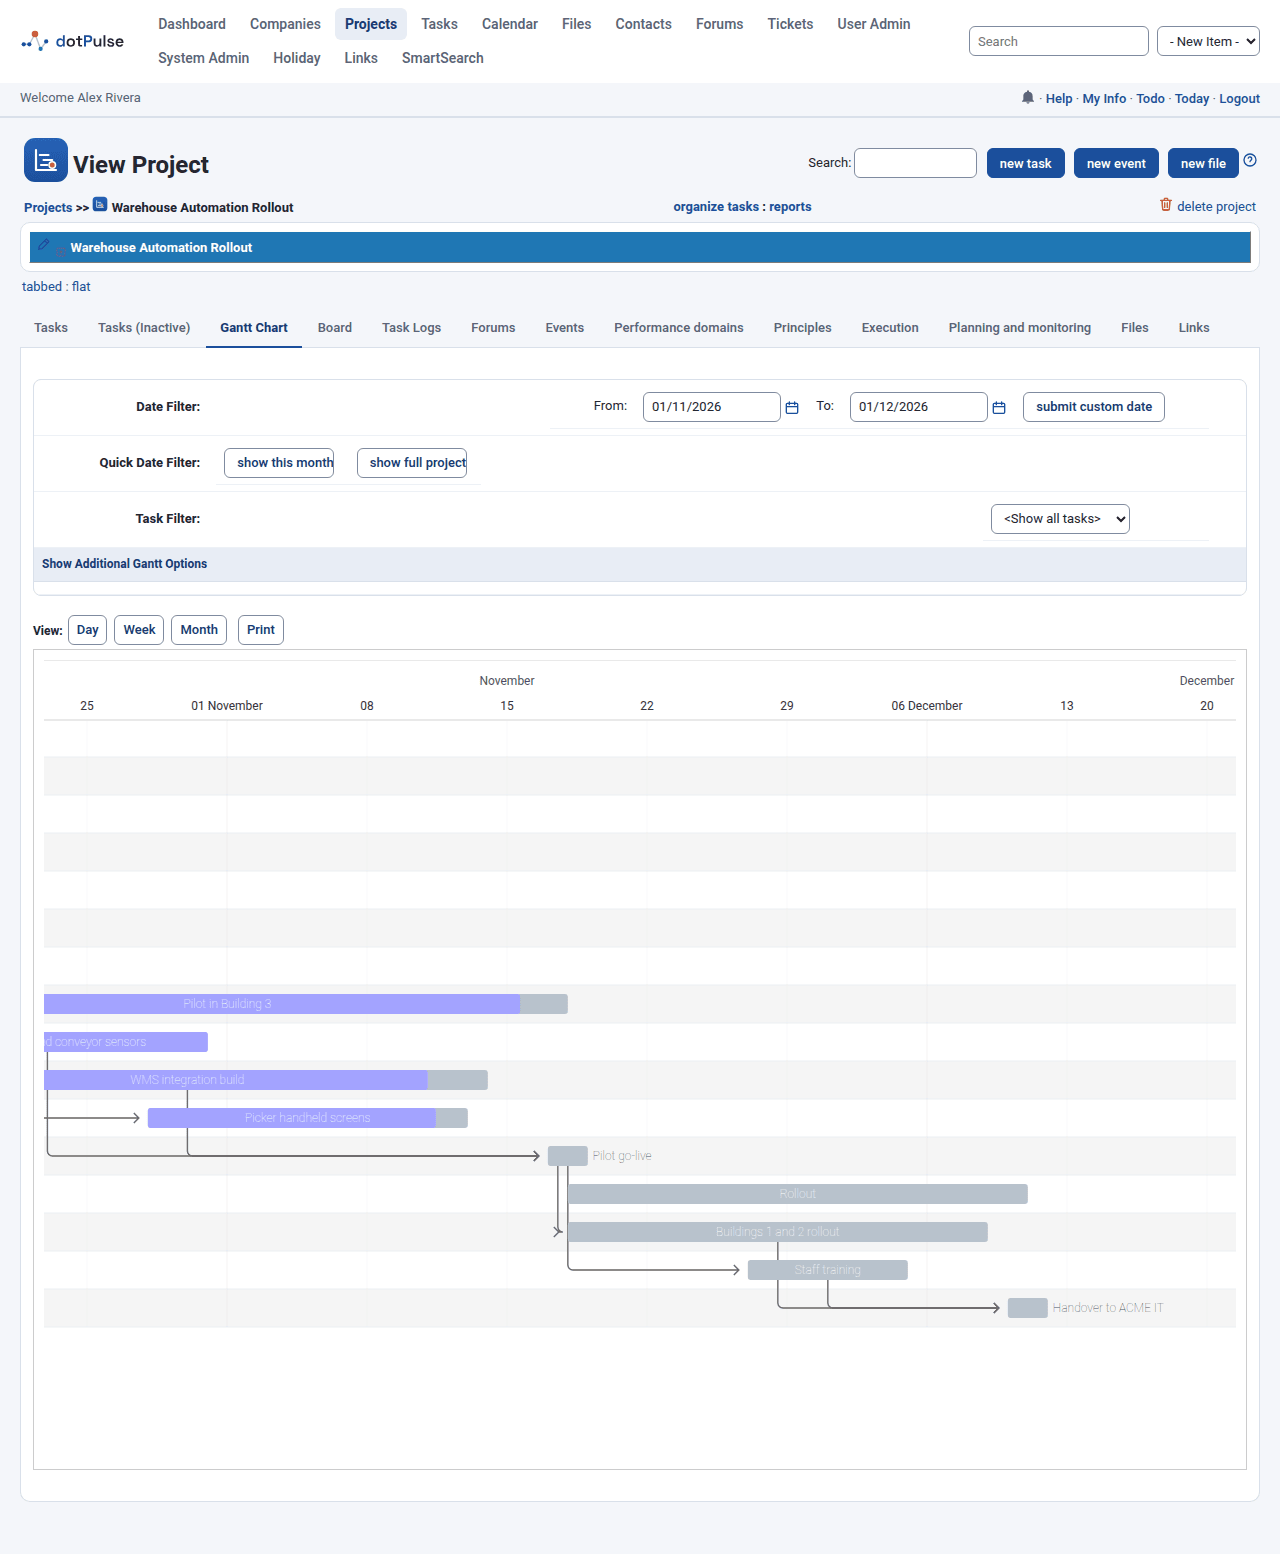
A Gantt chart draws each task or project as a bar from its start date to its end date. The darker part of a bar shows its progress.
You find Gantt charts in several places:
| Where | What it shows |
|---|---|
| A project's Gantt Chart tab | The tasks of that project. |
| Gantt Chart button under each project in the tasks list | The same chart, on its own page. |
| Projects › Gantt tab | The projects, and optionally their tasks. |
| Tasks › my todo › My Gantt tab | Your unfinished tasks. |
Read and move around the chart
- Use the View: buttons Day, Week and Month to change the scale. Charts open in Week view.
- When the chart covers today, it scrolls so that today is in view.
- Point at a bar to see its name, dates and percent complete.
- On task charts, arrows link a task to the tasks it depends on.
- Print prints the page.
Note
The chart is for viewing. Dragging a bar does not change the task. To change dates, edit the task.
A bar with no start date starts today (on the projects chart, a task with no start date starts with its project). A bar with no end date, or an end date before its start, is drawn one day long.
Filter a task chart
A project's task chart has these options above it:
- Date Filter: pick a From and To date with the calendar icons, then click submit custom date. The chart then shows only the tasks that overlap that period. The arrows at both ends move the period one month back or forward.
- Quick Date Filter: show full project removes the date limits.
- Task Filter: pick a task group to show only that group and the tasks under it. <Show all tasks> shows everything.
- Show Additional Gantt Options: opens more choices. Sort by Name orders the tasks by name instead of by start date. Hide Milestones leaves milestones out. Click submit to apply them.
Inactive tasks and tasks of archived projects are not shown.
On My Gantt, the additional options also include To Do Options: Pinned Only, Archived Projects, Projects on Hold, Dynamic Tasks and Low Priority Tasks. They work like the boxes on the to-do list and are shared with it.
The projects chart
Go to Projects and open the Gantt tab.
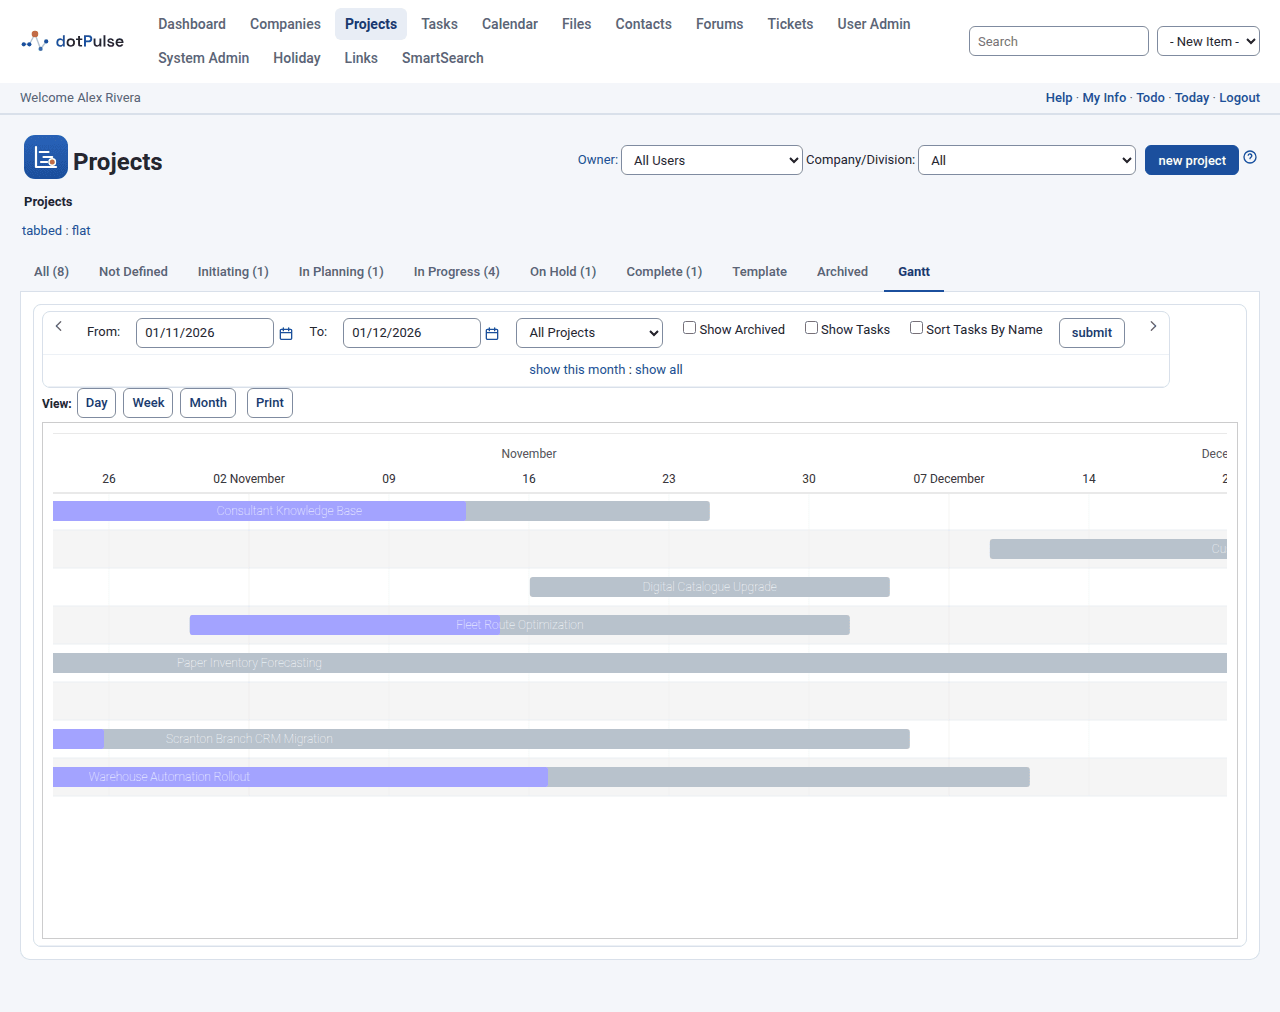
The options are:
- From and To, with the arrows to step a month back or forward, and submit to apply.
- A project filter: All Projects, All w/o in progress, My projects, or a single status.
- Show Archived: include archived projects.
- Show Tasks: draw each project's tasks under it.
- Sort Tasks By Name: order those tasks by name instead of by end date.
- show all removes the date limits.
The chart also follows the Company/Division filter of the projects list. Each project's bar shows its progress, worked out from its tasks.
The board
The Board tab of a project shows its tasks as cards in three columns:
| Column | Tasks with progress |
|---|---|
| To do | 0 % |
| In progress | between 1 % and 99 % |
| Done | 100 % |
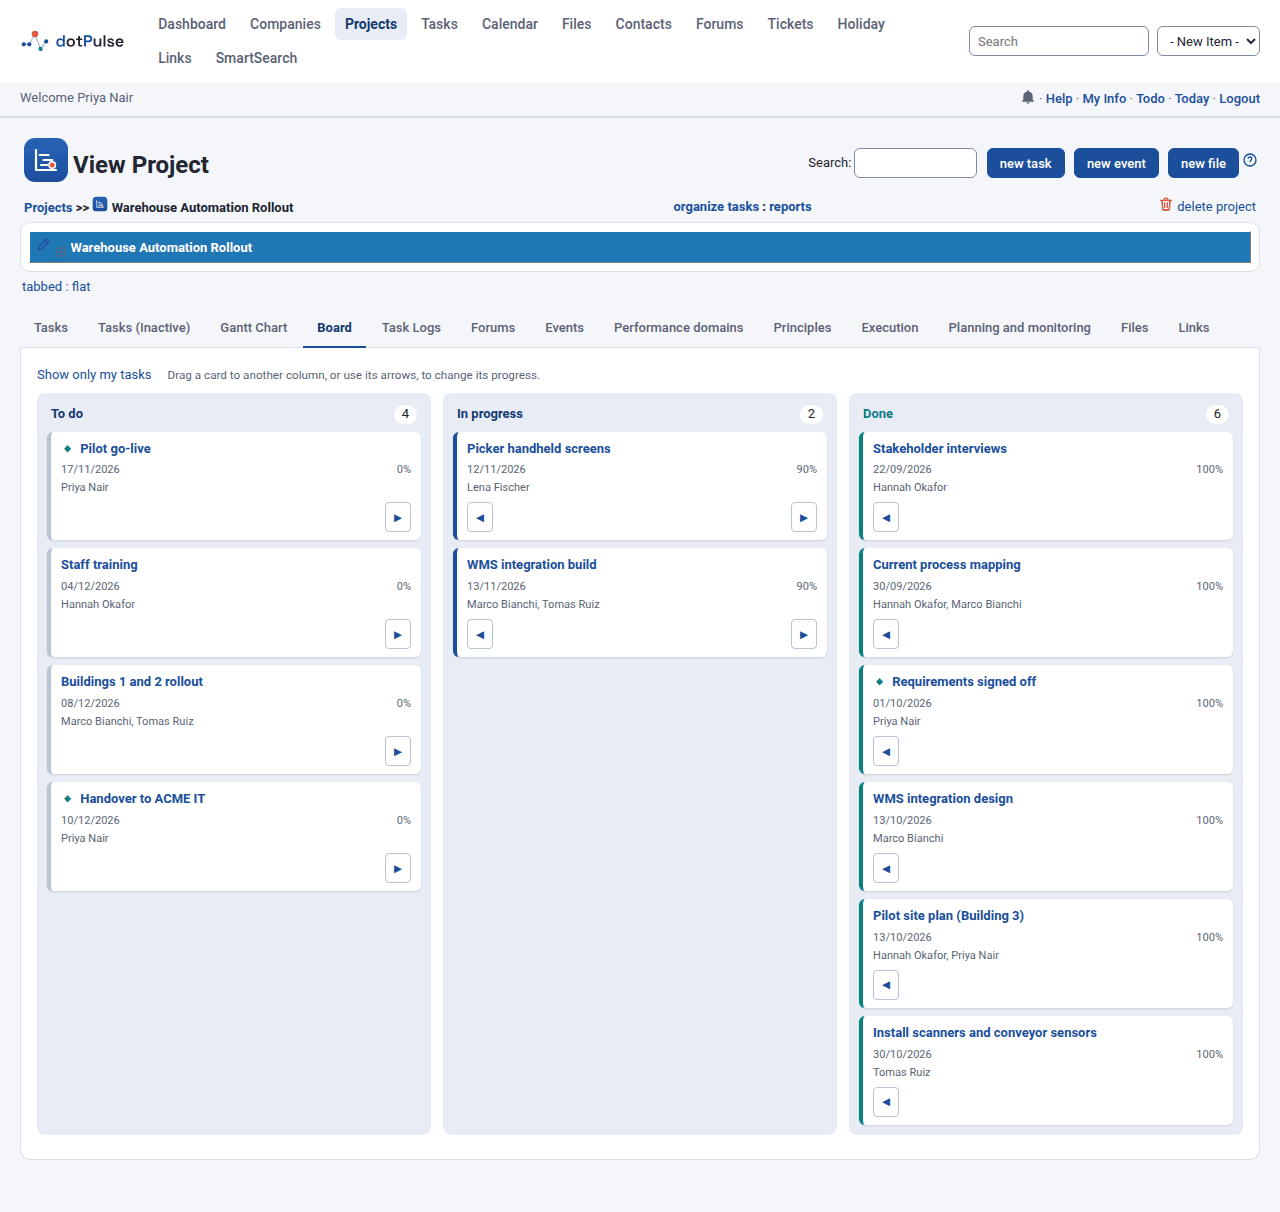
Each card shows the task name, its finish date and its progress. A finish date in the past, on a task that is not done, is marked as late. Below come the people assigned to the task. A diamond (◆) marks a milestone and an exclamation mark (!) a high priority task. Click the task name to open it.
The board shows the project's active tasks. Inactive tasks and task groups are left out, because a group's progress comes from its children. Cards are sorted by finish date; tasks with no finish date come last.
Click Show only my tasks to keep only the tasks assigned to you. Show all tasks brings the others back.
Move a card
You can move the cards of tasks you are allowed to edit. There are two ways:
- Drag the card to another column.
- Use the arrow buttons on the card (◀ and ▶) to move it one column left or right. The arrows also work from the keyboard.
Moving a card changes the task's progress:
- To To do: the progress becomes 0 %.
- To Done: the progress becomes 100 %. If the task had no finish date, today becomes its finish date.
- To In progress: a task coming from To do gets 10 %; a task coming from Done gets 90 %.
The card moves at once and the change is saved in the background. If dotPulse cannot save it, the card goes back to its column and a message says why.
Tip
The board only sets rough values. To record real progress and the hours you spent, log your work on the task.